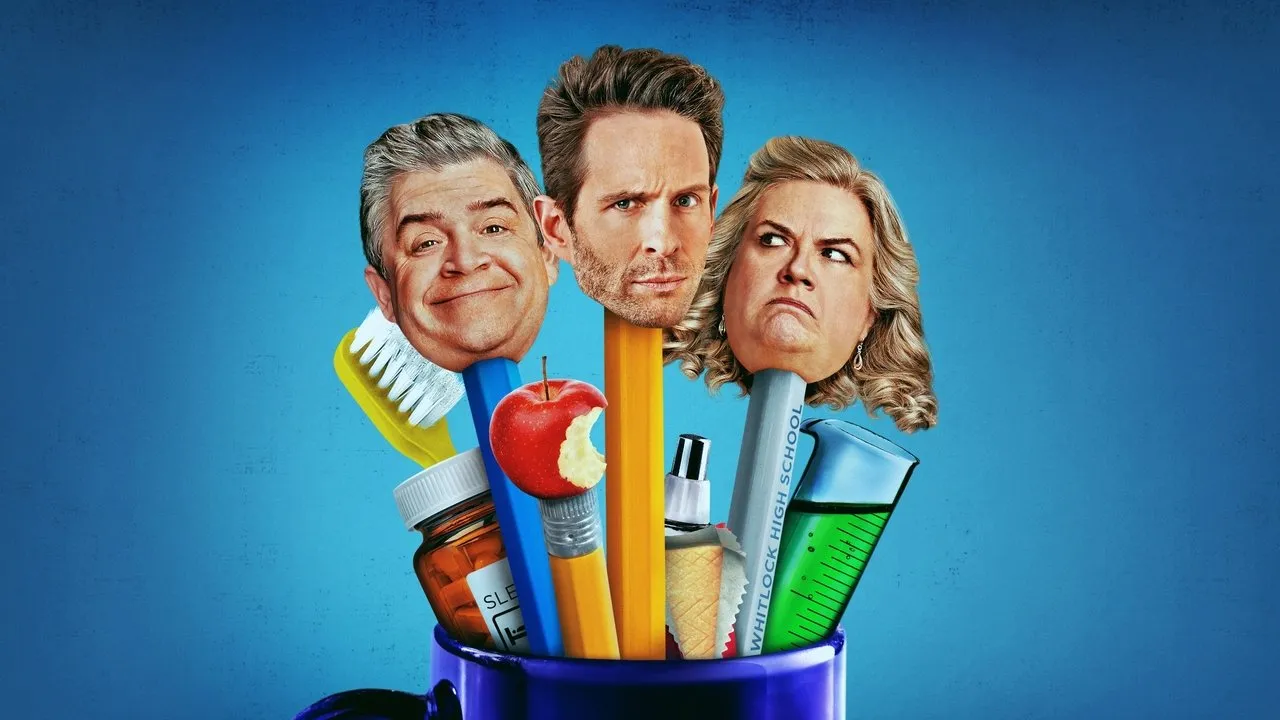


S1E11 Eight Pigs and a Rat
When one of Jack's students anonymously reports him for canceling their much-anticipated fetal pig dissection, he sets out to find the snitch. Durbin's chances at Principal of the Year are in jeopardy when the superintendent visits.