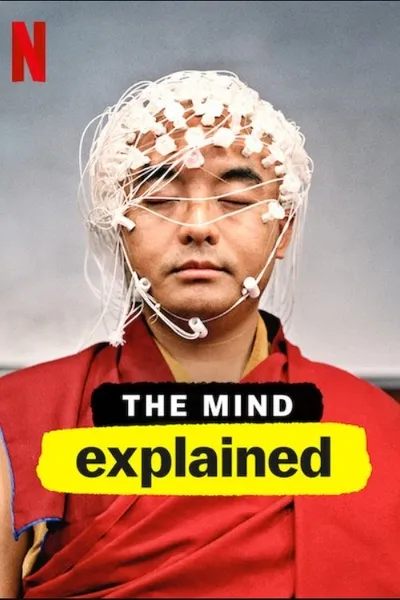
Episode Ratings Grid

Every episode at a glance, color-coded by rating. Rows are episode numbers within each season, columns are seasons.

M
S1
S2
S3
S4
S5
S6
S7
S8
E1
8.0
7.6
7.5
7.7
7.5
7.6
7.4
5.6
E2
8.2
8.1
7.3
7.8
7.2
7.9
6.9
5.2
E3
7.7
7.6
7.1
7.8
7.7
7.4
7.9
6.5
E4
7.7
6.9
7.8
7.0
7.9
7.5
5.6
E5
7.4
7.2
6.5
6.1
8.0
7.1
6.2
E6
7.6
7.1
7.1
7.4
7.3
8.0
5.3
E7
7.4
7.2
7.5
7.1
6.4
E8
7.6
7.1
6.9
8.0
5.8
E9
7.0
7.0
7.2
8.0
E10
7.4
7.2
7.2
7.3
E11
7.4
6.8
E12
7.6
6.3
Avg
8.0
7.5
7.2
7.2
7.3
7.7
7.5
5.8
Great
Good
Mid
Bad
SeriesScores.com

Episode Power Rankings

The best and worst episodes at a glance. Use this to find must-watch episodes or ones you might want to skip.

🏆 Top Episodes

#1 8.2

S1E2 Pay Attention!

When it comes to mastering and manipulating attention, some of the world's leading experts aren't scientists; they're magicians like David Copperfield. While the brain's attention acts a bit like a spotlight to filter and make sense of a busy world, it can be easily controlled and deceived. Copperfield and a team of experts test, trick and fool using an elegant form of attention control.

#2
S2E2 8.1

It's About Time

Ever wonder why a watched pot never boils? See how the brain can actually warp and shift time, giving a false impression of the order and the speed of events. Neuroscientist Dr. Chess Stetson explains the oddball effect using a series of pictures. Illusionist Apollo Robbins uses juggling pins to demonstrate what happens when the brain doesn't have enough time to process a large amount of information, while host Jason Silva plays with the speed of sound and light to find out why movies and television shows are sometimes out of sync.

#3
S1E1 8.0

Watch This!

Hack into the ultimate supercomputer ' the human brain ' as Hollywood filmmakers use color, light, motion, depth and sound to create mind-bending sensory illusions. Is it possible to feel the sensation of accidentally cutting your finger ' just by watching TV? Much of what we experience may be a mere fabrication, as our brains fill in gaps and stitch together a complete picture of the world bit-by-bit, designed to overcome our eyes' blind spots. But what happens when your senses get crossed?

  1. 4. S5E8 "Peer Pressure" 8.0
  2. 5. S5E9 "Logic" 8.0
  3. 6. S6E5 "Animal vs. Human" 8.0
  4. 7. S7E6 "The Survivor Brain" 8.0
  5. 8. S6E2 "Scams" 7.9
  6. 9. S6E4 "Perspective" 7.9
  7. 10. S7E3 "Brains Behaving Badly" 7.9

📉 Bottom Episodes

#67
S8E2 5.2

Ted Danson: Fact or Fiction

Actor Ted Danson learns how human brains distinguish fact from fiction in a series of games.

  1. 66. S8E6 "Mark Cuban: Power and Money" 5.3
  2. 65. S8E4 "Kids vs. Adults" 5.6
  3. 64. S8E1 "Male Brain vs. Female Brain" 5.6
  4. 63. S8E8 "Tiffany Haddish: Movie Magic" 5.8
SeriesScores.com

The Quality Arc

Each point is an episode, plotted chronologically. The colored bands mark season boundaries. Look for upward or downward trends to see if quality improved or declined over time.

S1 S2 S3 S4 S5 S6 S7 S8 4.55.46.37.28.19 Rating 7 14 21 28 35 42 49 56 63 70 Episode 10 9 8 7 6 5
SeriesScores.com

Episode Engagement

Vote count shows how many people cared enough to rate. High votes + high rating = beloved classic. High votes + low rating = notorious stinker. Low votes + high rating = hidden gem.

Rating threshold:
17 Standouts
17 Infamous
10 Hidden Gems
23 Forgettable
Standouts Infamous Hidden Gems Forgettable Global: 7.5 5.25.86.47.07.68.2 Rating 14 26 49 91 171 Votes (log scale)
Top Standout: S1E1 Watch This!
Most Infamous: S2E9 You Decide
Best Hidden Gem: S5E8 Peer Pressure

Episodes plotted by rating vs. vote count. The vertical line marks the rating threshold (7.5). More votes = more engagement. Toggle above to compare against global or show-specific median.

SeriesScores.com

Series Trajectory

A simplified view: one point per season. This smooths out episode-to-episode noise to show the overall arc of the series.

55.76.47.17.88.5 Rating S1 S2 S3 S4 S5 S6 S7 S8 Season 10 9 8 7 6 5
SeriesScores.com

Season Momentum

Did each season build momentum or fizzle out? Green arrows mean the finale rated higher than the premiere. Red means the opposite. Longer arrows = bigger swings.

45678910 Rating S1 8.0 7.7 -0.3 S2 7.6 7.4 -0.2 S3 7.4 7.1 -0.3 S4 7.8 6.8 -1.0 S5 7.3 7.7 +0.3 S6 7.8 7.7 -0.1 S7 7.2 7.5 +0.4 S8 5.4 6.1 +0.7
SeriesScores.com

Season Consistency

Some seasons are reliable bangers. Others are hit-or-miss. Each dot is an episode. Tightly clustered dots mean consistent quality. Scattered dots mean a mixed bag.

456789 Rating S1 Steady avg 8.0 S2 Steady avg 7.5 S3 Rock Solid avg 7.2 S4 Uneven avg 7.2 S5 Uneven avg 7.3 S6 Steady avg 7.7 S7 Typical avg 7.5 S8 Uneven avg 5.8 Episode Premiere/Finale

Each dot is an episode. Clustered dots = consistent quality. Scattered dots = variable season. Hover for episode details.

SeriesScores.com