
S1E10 It's Bubbly Time, Jerry
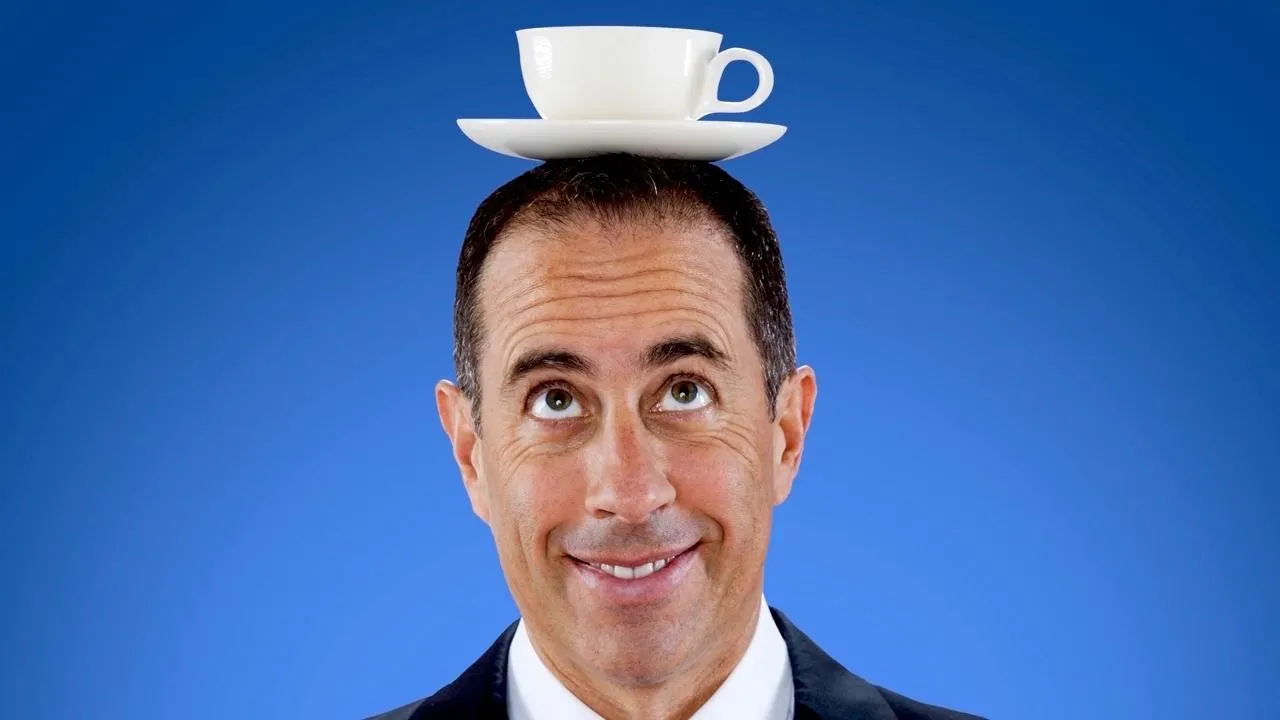
Jerry Seinfeld and his special guest, Michael Richards drive a 1962 Volkswagen Bus to The Malibu Kitchen in Malibu, CA for some coffee.
Jerry takes his comedy pals out for coffee in a selection of his classic automobiles. Larry David sums it up best when he says, 'You've finally made a show about nothing.'
Every episode at a glance, color-coded by rating. Rows are episode numbers within each season, columns are seasons.
The best and worst episodes at a glance. Use this to find must-watch episodes or ones you might want to skip.
Jerry Seinfeld and his special guest, Michael Richards drive a 1962 Volkswagen Bus to The Malibu Kitchen in Malibu, CA for some coffee.
Jerry and the “James Bond of comedy” Julia Louis-Dreyfus reminisce as they share a cappuccino after cruising the Pacific Palisades in a 1964 Aston Martin DB5.
For the premiere episode of Season 7, Jerry takes President Barack Obama for a spin in a 1963 Corvette Stingray Split Window Coupe but finds it hard to spirit the leader of the free world off the White House grounds.
Jerry Seinfeld and his special guest Miranda Sings cruise around town in a 1960 Austin Healey Sprite in search of coffee, complaining and apologizing along the way.
Each point is an episode, plotted chronologically. The colored bands mark season boundaries. Look for upward or downward trends to see if quality improved or declined over time.
Vote count shows how many people cared enough to rate. High votes + high rating = beloved classic. High votes + low rating = notorious stinker. Low votes + high rating = hidden gem.
Episodes plotted by rating vs. vote count. The vertical line marks the rating threshold (7.5). More votes = more engagement. Toggle above to compare against global or show-specific median.
A simplified view: one point per season. This smooths out episode-to-episode noise to show the overall arc of the series.
Did each season build momentum or fizzle out? Green arrows mean the finale rated higher than the premiere. Red means the opposite. Longer arrows = bigger swings.
Some seasons are reliable bangers. Others are hit-or-miss. Each dot is an episode. Tightly clustered dots mean consistent quality. Scattered dots mean a mixed bag.
Each dot is an episode. Clustered dots = consistent quality. Scattered dots = variable season. Hover for episode details.