S1E2 Slashers Part 1
Slasher films killed in the ’80s, but their violence, perceived misogyny, and endless sequels almost ended the genre. Supernatural killers Chucky and Freddy saved them from extinction.

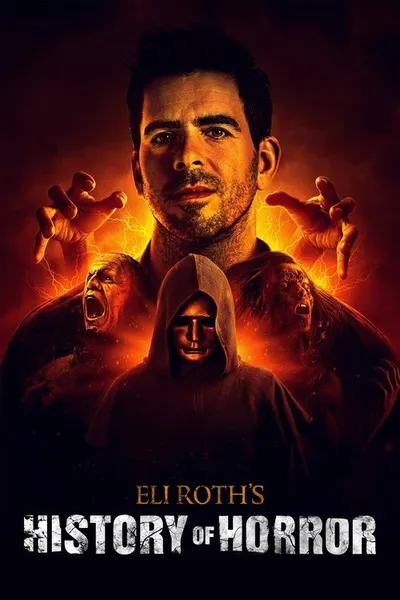
An in-depth look at the history and pop cultural significance of horror films.
Every episode at a glance, color-coded by rating. Rows are episode numbers within each season, columns are seasons.
The best and worst episodes at a glance. Use this to find must-watch episodes or ones you might want to skip.
Slasher films killed in the ’80s, but their violence, perceived misogyny, and endless sequels almost ended the genre. Supernatural killers Chucky and Freddy saved them from extinction.
Zombies are the monsters of the 21st century, and America's major contribution to horror. What set off zombie fever? All roads lead to George Romero, who made zombies a metaphor for social ills.
Ghost movies have been with us since the dawn of cinema. Some ghosts are benevolent, some ghosts are malicious, but they all represent the mystery of what happens to us after we die. Stephen King, Haley Joel Osment and others break down the appeal of spooky spirits.
From Frankenstein to Frank N. Furter, mad scientists smash the barriers of polite society; featuring "Frankenstein," "Ex Machina," "The Invisible Man," "The Fly," "Dr. Jekyll and Mr. Hyde," "Altered States" and "The Rocky Horror Picture Show."
Each point is an episode, plotted chronologically. The colored bands mark season boundaries. Look for upward or downward trends to see if quality improved or declined over time.
Vote count shows how many people cared enough to rate. High votes + high rating = beloved classic. High votes + low rating = notorious stinker. Low votes + high rating = hidden gem.
Episodes plotted by rating vs. vote count. The vertical line marks the rating threshold (7.5). More votes = more engagement. Toggle above to compare against global or show-specific median.
A simplified view: one point per season. This smooths out episode-to-episode noise to show the overall arc of the series.
Did each season build momentum or fizzle out? Green arrows mean the finale rated higher than the premiere. Red means the opposite. Longer arrows = bigger swings.
Some seasons are reliable bangers. Others are hit-or-miss. Each dot is an episode. Tightly clustered dots mean consistent quality. Scattered dots mean a mixed bag.
Each dot is an episode. Clustered dots = consistent quality. Scattered dots = variable season. Hover for episode details.