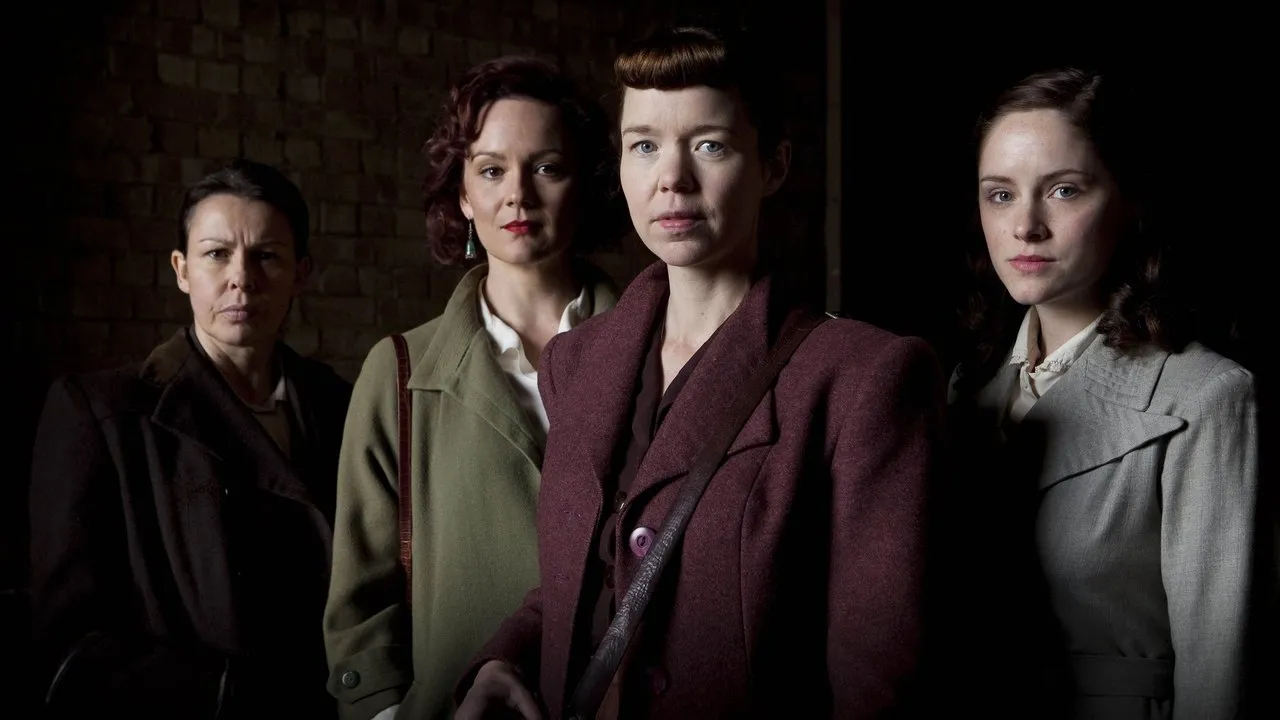
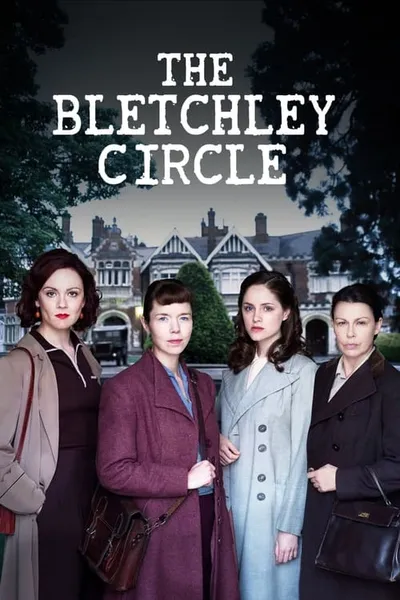
The Bletchley Circle follows the journey of four ordinary women with extraordinary skills that helped to end World War II. Set in 1952, Susan, Millie, Lucy and Jean have returned to their normal lives, modestly setting aside the part they played in producing crucial intelligence, which helped the Allies to victory and shortened the war. When Susan discovers a hidden code behind an unsolved murder she is met by skepticism from the police. She quickly realises she can only begin to crack the murders and bring the culprit to justice with her former friends. The Bletchley Circle paints a vivid portrait of post-war Britain in this fictional tale of unsung heroes.
Episode Ratings Grid
Every episode at a glance, color-coded by rating. Rows are episode numbers within each season, columns are seasons.
The best and worst episodes at a glance. Use this to find must-watch episodes or ones you might want to skip.
🏆 Top Episodes
#1 8.1
S1E2Cracking a Killer's Code: Part 2
As Susan and the other Bletchley women close in on the murderer of the five girls, a shocking discovery calls their theories into question and forces them to set a dangerous trap - a trap that puts one of them in even greater danger.
#2
S1E1 8.0
Cracking a Killer's Code: Part 1
When Susan Gray spots a hidden pattern in a series of murders, she tries to inform the police. But when they and her husband insist she forget her theory Susan enlists her wartime friends to try and track down the murderer.
#3
S1E3 7.9
Cracking a Killer's Code: Part 3
Thrown into a chilling confrontation with the murderer they have so brilliantly tracked down, Susan and the other Bletchley women become locked into a ever more dangerous game of cat and mouse that leads to a seemingly inescapable conclusion.
4. S2E2 "Blood on Their Hands: Part 2" 7.8
5. S2E4 "Uncustomed Goods: Part 2" 7.8
6. S2E1 "Blood on Their Hands: Part 1" 7.7
7. S2E3 "Uncustomed Goods: Part 1" 7.6
📉 Bottom Episodes
#7
S2E3 7.6
Uncustomed Goods: Part 1
Spirited Millie is earning a bit of money selling odds and ends on the black market. But Millie stumbles across a seam of post-Second World War unwholesomeness when she annoys some very dangerous people and gets into trouble. Soon, the other Bletchley girls must rally to her aid.
6. S2E1 "Blood on Their Hands: Part 1" 7.7
5. S2E4 "Uncustomed Goods: Part 2" 7.8
4. S2E2 "Blood on Their Hands: Part 2" 7.8
3. S1E3 "Cracking a Killer's Code: Part 3" 7.9
The Quality Arc
Each point is an episode, plotted chronologically. The colored bands mark season boundaries. Look for upward or downward trends to see if quality improved or declined over time.
Episode Engagement
Vote count shows how many people cared enough to rate. High votes + high rating = beloved classic. High votes + low rating = notorious stinker. Low votes + high rating = hidden gem.
Rating threshold:
4Standouts
0Infamous
3Hidden Gems
0Forgettable
Top Standout:S1E1Cracking a Killer's Code: Part 1
Best Hidden Gem:S2E2Blood on Their Hands: Part 2
Episodes plotted by rating vs. vote count. The vertical line marks the rating threshold (7.5).
More votes = more engagement. Toggle above to compare against global or show-specific median.
Season Momentum
Did each season build momentum or fizzle out? Green arrows mean the finale rated higher than the premiere. Red means the opposite. Longer arrows = bigger swings.
Season Consistency
Some seasons are reliable bangers. Others are hit-or-miss. Each dot is an episode. Tightly clustered dots mean consistent quality. Scattered dots mean a mixed bag.
Each dot is an episode. Clustered dots = consistent quality. Scattered dots = variable season. Hover for episode details.