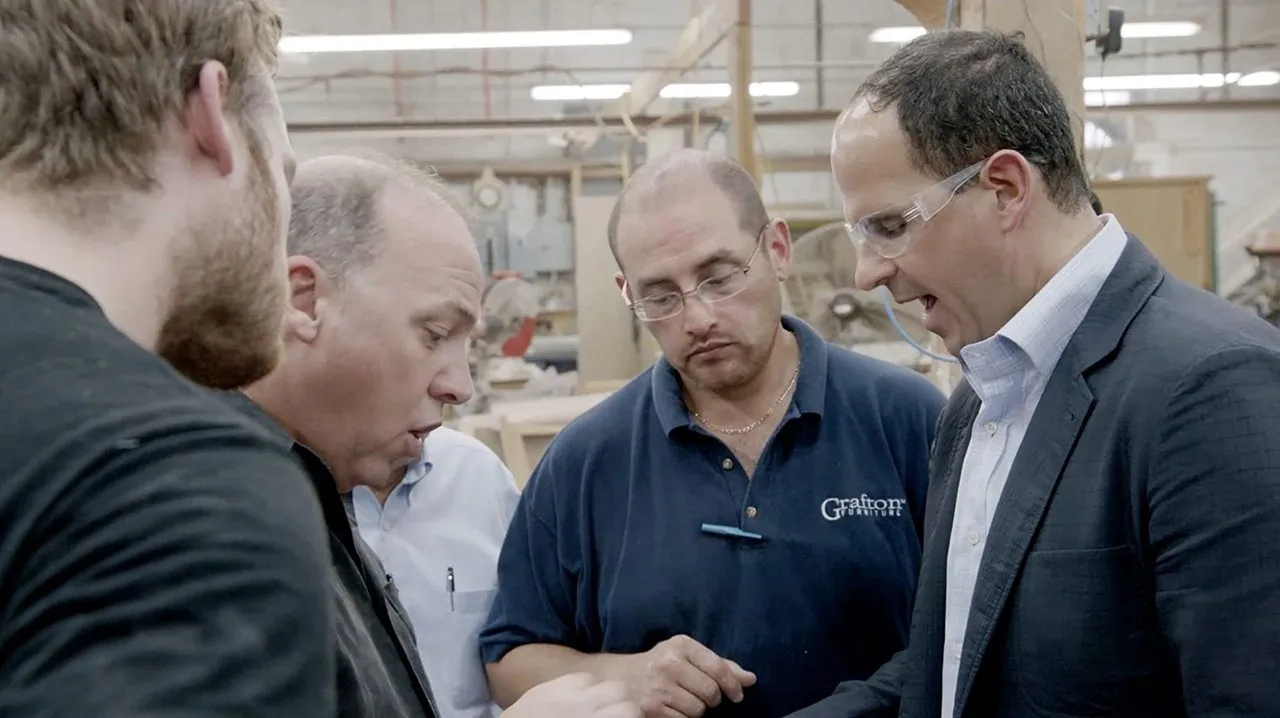
When Marcus Lemonis isn’t running his multi-billion dollar company, Camping World, he goes on the hunt for struggling businesses that are desperate for cash and ripe for a deal. In the past 10 years, he’s successfully turned around over 100 companies. Now he’s bringing those skills to CNBC and doing something no one has ever done on TV before … he’s putting millions of dollars of his own money on the line. In each episode, Lemonis makes an offer that’s impossible to refuse; his cash for a piece of the business and a percentage of the profits. And once inside these companies, he’ll do almost anything to save the business and make himself a profit; even if it means firing the president, promoting the secretary or doing the work himself.
Episode Ratings Grid
Every episode at a glance, color-coded by rating. Rows are episode numbers within each season, columns are seasons.
The best and worst episodes at a glance. Use this to find must-watch episodes or ones you might want to skip.
🏆 Top Episodes
#1 9.2
S5E12The Casery
A Los Angeles startup is creating buzz with its fashion-forward cell-phone cases; behind its breathtaking sales, the cracks are starting to show; its CEO does whatever he pleases, leaving his partners demoralized and the business unable to grow.
#2
S2E6 8.9
Sweet Pete's
Candy maker Sweet Pete's has excellent products, but the business is failing.
#3
S2E15 8.7
Shuler's BBQ
Business is good at a South Carolina barbecue restaurant, but there is issues keeping up with the demands of hungry customers who are lined up outside.
4. S2E7 "Amazing Grapes" 8.6
5. S5E5 "Mr. Cory's Cookies" 8.5
6. S5E19 "The Profit An Inside Look: LA Dogworks" 8.5
7. S2E1 "Athans Motors" 8.4
8. S5E10 "Fighting for Farrell's" 8.3
9. S2E2 "A. Stein Butchers" 8.1
10. S2E4 "Worldwide Trailer Sales, Inc" 8.1
📉 Bottom Episodes
#112
S8E6 5.4
A New Leash on Life
A business owner with a love of animals gives Marcus a new challenge. While her product is great, she lacks some of the business skills to bring it to the masses. Marcus will need to help her find the same passion for profits she has for her pets, if this business' true potential is to be unleashed.
111. S8E4 "Sweet Dreams Are Made of This" 5.7
110. S7E7 "Las Vegas Mini Gran Prix" 5.8
109. S7E3 "Skinny Latina" 5.9
108. S8E2 "Any Way You Slice It" 6.0
The Quality Arc
Each point is an episode, plotted chronologically. The colored bands mark season boundaries. Look for upward or downward trends to see if quality improved or declined over time.
Episode Engagement
Vote count shows how many people cared enough to rate. High votes + high rating = beloved classic. High votes + low rating = notorious stinker. Low votes + high rating = hidden gem.
Rating threshold:
39Standouts
21Infamous
19Hidden Gems
33Forgettable
Top Standout:S2E6Sweet Pete's
Most Infamous:S8E4Sweet Dreams Are Made of This
Best Hidden Gem:S5E19The Profit An Inside Look: LA Dogworks
Episodes plotted by rating vs. vote count. The vertical line marks the rating threshold (7.5).
More votes = more engagement. Toggle above to compare against global or show-specific median.
Series Trajectory
A simplified view: one point per season. This smooths out episode-to-episode noise to show the overall arc of the series.
Season Momentum
Did each season build momentum or fizzle out? Green arrows mean the finale rated higher than the premiere. Red means the opposite. Longer arrows = bigger swings.
Season Consistency
Some seasons are reliable bangers. Others are hit-or-miss. Each dot is an episode. Tightly clustered dots mean consistent quality. Scattered dots mean a mixed bag.
Each dot is an episode. Clustered dots = consistent quality. Scattered dots = variable season. Hover for episode details.