


S1E2 Kerosene. Match. Boom!
Endless trash and seething heat feed the chaos on day two as performers are pelted with debris and Limp Bizkit riles the crowd to its breaking point.
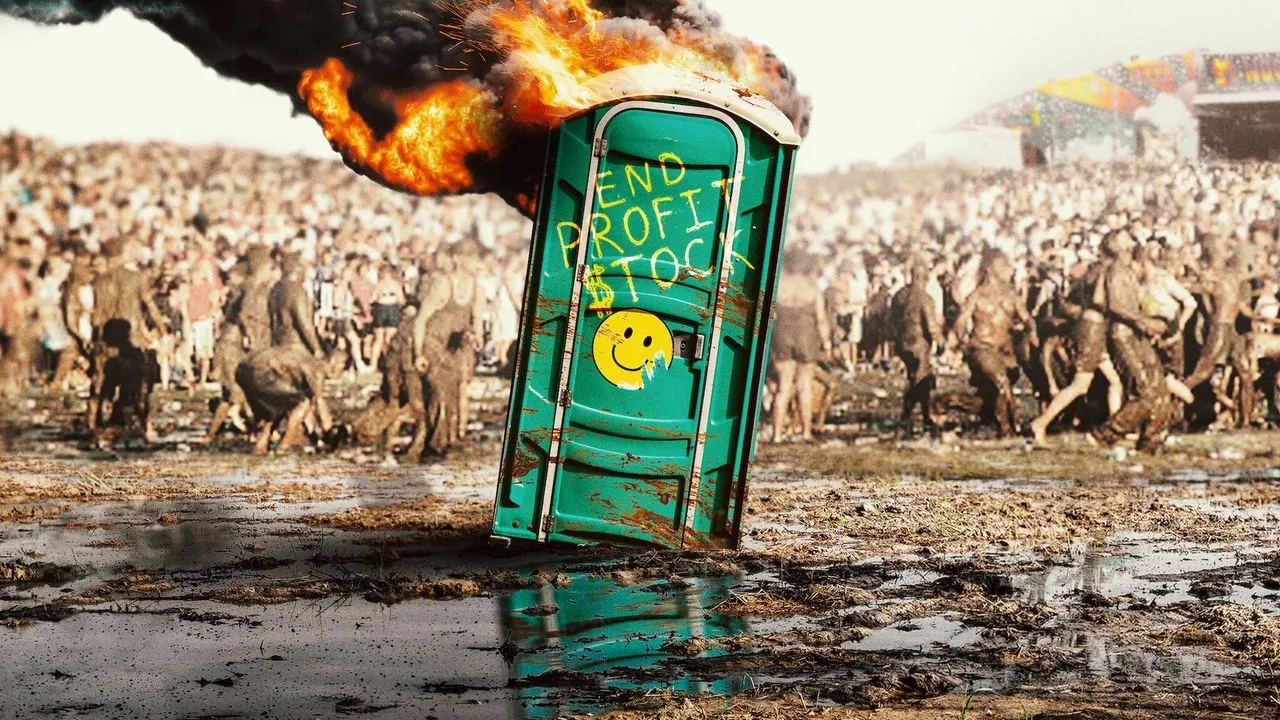
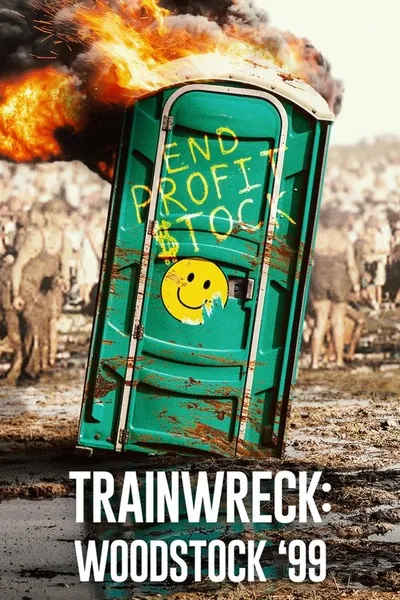
Woodstock 1969 promised peace and music, but its '99 revival delivered days of rage, riots and real harm. Why did it go so horribly wrong?
Every episode at a glance, color-coded by rating. Rows are episode numbers within each season, columns are seasons.
The best and worst episodes at a glance. Use this to find must-watch episodes or ones you might want to skip.
Endless trash and seething heat feed the chaos on day two as performers are pelted with debris and Limp Bizkit riles the crowd to its breaking point.
The 1999 fest takes a hard swerve away from 1969 Woodstock co-creator Michael Lang's vision with a military base locale, profit focus and toxic vibe.
Tainted water and price gouging mar day three. Fear grips the finale, fires spread, and the mob takes over. Later, sexual assault allegations emerge.
Tainted water and price gouging mar day three. Fear grips the finale, fires spread, and the mob takes over. Later, sexual assault allegations emerge.
Each point is an episode, plotted chronologically. The colored bands mark season boundaries. Look for upward or downward trends to see if quality improved or declined over time.
Vote count shows how many people cared enough to rate. High votes + high rating = beloved classic. High votes + low rating = notorious stinker. Low votes + high rating = hidden gem.
Episodes plotted by rating vs. vote count. The vertical line marks the rating threshold (7.5). More votes = more engagement. Toggle above to compare against global or show-specific median.
Did each season build momentum or fizzle out? Green arrows mean the finale rated higher than the premiere. Red means the opposite. Longer arrows = bigger swings.
Some seasons are reliable bangers. Others are hit-or-miss. Each dot is an episode. Tightly clustered dots mean consistent quality. Scattered dots mean a mixed bag.
Each dot is an episode. Clustered dots = consistent quality. Scattered dots = variable season. Hover for episode details.