


S2E13 Clementine
Mitch and Jamie hatch a daring plan to undermine the Noah Objective once and for all, and the team reunites on the Island of Pangaea where the final pieces of the cure are put in place.

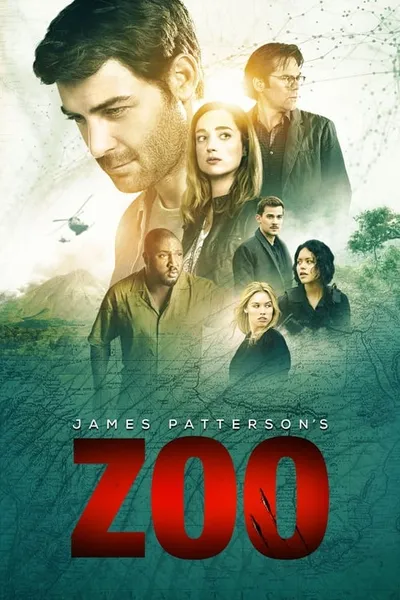
Set amidst a wave of violent animal attacks sweeping across the planet, a young renegade scientist is thrust into a race to unlock the mystery behind this pandemic before time runs out for animals and humans alike.
Every episode at a glance, color-coded by rating. Rows are episode numbers within each season, columns are seasons.
The best and worst episodes at a glance. Use this to find must-watch episodes or ones you might want to skip.
Mitch and Jamie hatch a daring plan to undermine the Noah Objective once and for all, and the team reunites on the Island of Pangaea where the final pieces of the cure are put in place.
Chloe tries to bring light to the rising threat from the animals. Jackson is taken to a hospital and while they are there Mitch works to create a cure. However, there are many obstacles they must overcome.
Chloe is taken hostage by someone she knows. Jackson and the others are arrive at Zambia to find the leopard to test Mitch's theory of the animal mutation.
The team races to stop the hybrids from breaching the barrier wall by shutting down the last beacon that draws them in.
Each point is an episode, plotted chronologically. The colored bands mark season boundaries. Look for upward or downward trends to see if quality improved or declined over time.
Vote count shows how many people cared enough to rate. High votes + high rating = beloved classic. High votes + low rating = notorious stinker. Low votes + high rating = hidden gem.
Episodes plotted by rating vs. vote count. The vertical line marks the rating threshold (7.5). More votes = more engagement. Toggle above to compare against global or show-specific median.
A simplified view: one point per season. This smooths out episode-to-episode noise to show the overall arc of the series.
Did each season build momentum or fizzle out? Green arrows mean the finale rated higher than the premiere. Red means the opposite. Longer arrows = bigger swings.
Some seasons are reliable bangers. Others are hit-or-miss. Each dot is an episode. Tightly clustered dots mean consistent quality. Scattered dots mean a mixed bag.
Each dot is an episode. Clustered dots = consistent quality. Scattered dots = variable season. Hover for episode details.